Market Outlook
April 13, 2018
Market Cues
Domestic Indices
Chg (%)
(Pts)
(Cl ose)
Indian markets are likely to open flat tracking global indices and SGX Nifty.
BSE Sensex
0.5
161
34,101
U.S. stocks continued to turn in a strong performance throughout the trading day.
Nifty
0.4
41
10,459
The major averages climbed firmly in positive territory, offsetting the weakness seen
Mid Cap
(0.1)
(21)
16,601
in the previous session. The Dow Jones ended up by 1.2% to close at 24,483. The
Small Cap
(0.3)
(49)
17,935
NASDAQ ended up by 1.0% to close at 7,140.
Bankex
0.4
99
28,273
U.K. stocks were fluctuating during the last trading session as escalating tensions
surrounding Syria and disappointing house price data offset investor excitement over
Global Indices
Chg (%)
(Pts)
(Cl ose)
a fresh round of corporate deal making. The FTSE 100 was closed flat to end at
7,258.
Dow Jones
1.2
294
24,483
Nasdaq
1.0
71
7,140
On domestic front, Indian shares rose for a sixth straight session even as overall
FTSE
0.0
1
7,258
gains remained limited amid rising oil prices and lingering concerns over a possible
Nikkei
0.5
109
21,770
U.S. missile strike on Syria. Investors also shrugged off a hawkish tone out of the
FOMC's meeting minutes. The BSE Sensex ended up by 0.5% at 34,101.
Hang Seng
0.1
21
30,852
Shanghai Com
(0.1)
(2)
3,179
News Analysis
Feb IIP growth dips to 7.1%; March retail inflation at 5-month low of 4.28%
A dvances / Declines
BSE
NSE
Detailed analysis on Pg2
Advances
1,132
741
Declines
1,569
1,042
Investor’s Ready Reckoner
Unchanged
137
78
Key Domestic & Global Indicators
Stock Watch: Latest investment recommendations on 150+ stocks
Volumes (` Cr)
Refer Pg5 onwards
BSE
3,539
Top Picks
NSE
29,397
C MP
Target
U psi de
C ompany
Sector
R ating
(`)
(`)
(%)
Blue Star
Capital Goods Accumulate
786
867
10.3
Net Inflows (` Cr)
Ne t
Mtd
Ytd
Dewan Housi ng Finance
Financials
Buy
527
720
36.5
FII
444
(1,296)
12,311
Century Plyboards
Forest Product
Buy
345
400
15.9
*MFs
(6)
3,764
38,224
Navkar Corporation
Others
Buy
175
265
51.4
KEI Industrie s
Capital Goods Accumulate
441
485
10.1
More Top Picks on Pg4
Top Gainers
Price (`)
Chg (%)
RELIGARE
59
9.5
Key Upcoming Events
Previous
C onsensus
DISHTV
80
8.1
D ate
Region
Event Description
ReadingExpectations
TATASPONGE
1,169
8.1
Apr 13, 2018 India
Exports YoY%
4.48
Apr 13, 2018 India
Imports YoY%
10.41
HCLTECH
1,011
4.5
Apr 13, 2018 China
Exports YoY%
44.50
11.80
GMDCLTD
139
4.2
Apr 16, 2018 US
Industrial Production
0.95
0.30
Apr 17, 2018 India
Monthly Wholesale Prices YoY%
2.48
2.50
Top Losers
Price (`)
Chg (%)
More Events on Pg7
IBVENTUREPP
120
-9.9
APLLTD
500
-6.3
ADANIENT
136
-5.8
BALRAMCHIN
73
-5.4
VAKRANGEE
140
-5.0
As on April 12, 2018
Market Outlook
April 13, 2018
News Analysis
Feb IIP growth dips to 7.1%; March retail inflation at 5-month low of
4.28%
Maintaining high growth for the fourth month in a row, industrial production grew
at 7.1% in February, mainly driven by robust performance of the manufacturing
sector coupled with higher off take of capital goods and consumer durables.
Retail inflation slowed to five-month low of 4.28% in March, the third consecutive
month of decline, mainly on account of easing food prices including vegetables.
The IIP recorded a growth of 8.54% in November, 7.1% in December and 7.4% in
January. During April-February, IIP growth has slowed to 4.3% from 4.7% in the
same period last fiscal. Consumer durables too grew at 7.9% as against a
contraction of 4.6% in February 2017. Electricity generation also grew by 4.5%
compared to 1.2%. However, mining output declined by 0.3% against a growth
4.6% earlier.
Economic and Political News
Rs 8-trn projects under Sagaramala in motion but funding a challenge
Sebi issues disclosure norms to govern new MF schemes post-merger
Startups with up to Rs 100-million investment to get tax concession
Corporate News
Thyssenkrupp, Tata Steel delay signing of JV; may take place after June
Odisha slaps Rs 32 billion demand notice on Tata Steel, OMC & others
Essar Oil still owes about 500-mn euros for previous purchases to Iran
Manwani to retire as non-executive chairman of HUL, Sanjiv Mehta to
succeed
Market Outlook
April 13, 2018
Quarterly Bloomberg Brokers Consensus Estimate
RBL Ltd. - April 13, 2018
Particulars ( ` cr)
3QFY18E
3QFY17
y-o-y (%)
2QFY18
q-o-q (%)
PAT
170
130
30.7
165
2.9
Infosys Ltd - April 13, 2018
Particulars ( ` cr)
3QFY18E
3QFY17
y-o-y (%)
2QFY18
q-o-q (%)
Sales
18116
17120
5.8
17794
1.8
EBIDTA
4874
4633
5.2
4817
1.2
%
26.9
27.1
27.1
PAT
3698
3603
2.6
5129
(27.9)
Market Outlook
April 13, 2018
Top Picks
Market Cap
C MP
Target
Upside
C ompany
R ationale
(` Cr)
(`)
(`)
(%)
Strong growth in domestic business due to its
leadership in acute therapeutic segment. Alkem
Alkem Laboratories
21,024
1,758
2,441
38.8
expects to launch more products in USA, which
bode s for its internati onal business.
Favorable outlook for the AC industry to augur well
for Cooling products business which is out pacing
Blue Star
7,547
786
867
10.3
the market growth. EMPPAC division's profitability
to improve once oper ating environme nt turns
around.
With a focus on the low and me dium income (LMI)
consumer se gment, the company has increase d its
Dewan Housi ng Finance
16,542
527
720
36.5
presence in tier-II & III cities where the growth
opportunity i s immense.
Well capitalized with CAR of 18.1% which give s
sufficient room to grow asset base. F aster re solution
ICICI Bank
184,129
286
416
45.2
of NPA would reduce provi sion cost, which would
help to re port better ROE.
High order book execution in EPC segment, rising
KEI Industrie s
3,452
441
485
10.1
B2C sales and hi gher exports to boost the revenue s
and profitability
Expected to benefit from the lower capex
Music Broadcast Limited
2,213
388
475
22.5
requirement and 15 year long radio broadcast
licensing.
Massive capacity expansion along with rail
Navkar Corporation
2,634
175
265
51.4
advantage at ICD as well CFS augur well for the
company
Strong brands and distribution network would boost
Siyaram Silk Mills
3,383
722
851
17.9
growth goi ng ahe ad. Stock currently trades at an
inexpensive valuation.
Market leadership in Hindi news genre and no. 2
viewership ranking in English news genre, exit from
TV Today Network
2,842
476
603
26.6
the radio busine ss, and anticipated growth in ad
spends by corporate to benefit the stock.
After GST, the company is expected to see higher
volume s along with improving product mix. The
Maruti
277,862
9,198
10,619
15.4
Gujarat plant will also enable higher operating
leverage which will be margin accretive.
We expect loan book to grow at 24.3% over next
GIC Housing
2,195
408
655
60.7
two year; change in borrowing mix will help in NIM
improve ment
We expect CPIL to report net Revenue/PAT CAGR of
~17%/ 16% over FY2017-20E mainly due to
Century Plyboards
7,665
345
400
15.9
healthy growth in plywood & lamination busine ss,
forayed into MDF & Particle boards on back of
strong brand & distribution network.
We expect sales/PAT to grow at 13.5%/ 20% over
LT Foods
3,013
94
128
35.9
next two years on the back of strong di stribution
network & addition of new products in portfolio.
Third large st brand play in luggage segment
Increase d product offerings and improvi ng
Safari Industries
1,408
633
670
5.9
distribution network is leading to strong growth in
busine ss. Likely to post robust growth for next 3-4
years
We expect HSIL to report PAT CAGR of ~15% over
FY2017-20E owing to better improve ment in
HSIL Ltd
2,884
399
510
27.8
operating margi n due price hi ke in container glass
segment, turnaround in consumer busine ss.
We expect financi alisation of savings and
Aditya Birla Capital
35271
160
230
42.0
increasing penetration in Insurance & Mutual fund
would ensure steady growth.
Source: Company, Angel Research
Market Outlook
April 13, 2018
Fundamental Call
Market Cap
C MP
Target
Upside
C ompany
R ationale
(` Cr)
(`)
(`)
(%)
CCL is likely to maintain the strong growth trajectory
CCL Products
3,837
288
360
24.8
over FY18-20 backed by capacity expansi on and new
geographical foray
We forecast Nilkamal to report top-line CAGR of ~9%
to `2,635cr over FY17-20E on the back of healthy
Nilkamal
2,568
1,721
2,178
26.5
demand growth in pl astic division. On the bottom -line
front, we estimate ~10% CAGR to `162cr owing to
improve ment in volumes.
The prism has diversified exposure in the different
segment such as Cement, Tile & ready mix concrete.
Prism Cement
5,786
115
160
39.2
Thus we believe, PCL is in the right place to capture
ongoing government spendi ng on affordable housing
and infrastructure projects.
Elantas Beck India is the Indian market leader in liquid
insulation segment use d in electrical equipments like
Elantas Beck India Ltd
1,732
2,185
2,500
14.4
motors, transformers etc. It derives demand from
several industries which are expected to register 10%+
CAGR in demand in the coming years.
Greenply Industries Ltd (GIL) manufactures plywood &
allied products and medium density fibreboards
(MDF). GIL to report net reve nue CAGR of ~14% to
Greenply Industries
3,920
320
395
23.6
~`2,478cr over F Y2017-20E mainly due to healthy
growth in plywood & lamination busine ss on the back
of strong brand and di stribution network
Ashok Leyland Ltd (ALL) is the flagship company of the
Hinduja Group, and one of the largest commercial
vehicle manufacturers in India. Ashok Leyland
Ashok Leyland
42,414
145
163
12.5
expected to report net Profit (reported) CAGR of ~19%
to
~`2,075cr over FY2017-20E mainly due to
improve ment in replace ment demand.
Source: Company, Angel Research
Market Outlook
April 13, 2018
Key Upcoming Events
Global economic events release calendar
Bl oomberg Data
D ate
Time
C ountry
Event Description
Unit
Period
L ast Reporte d
E stimate d
Apr 13, 2018
India
Exports YoY%
% Change
Mar
4.48
India
Imports YoY%
% Change
Mar
10.41
China
Exports YoY%
% Change
Mar
44.50
11.80
Apr 16, 2018
6:45 PM US
Industrial Production
%
Mar
0.95
0.30
Apr 17, 2018
12: 00 PM India
Monthly Wholesale Prices YoY%
% Change
Mar
2.48
2.50
2:00 PM UK
Joble ss claims change
% Change
Mar
9.20
6:00 PM US
Housi ng Starts
Thousands
Mar
1,236.00
1,260.00
6:00 PM US
Building permits
Thousands
Mar
1,321.00
1,325.00
7:30 AM China
Industrial Production (YoY)
% Change
Mar
6.20
6.40
7:30 AM China
Real GDP (YoY)
% Change
1Q
6.80
6.80
Apr 18, 2018
2:00 PM UK
CPI (YoY)
% Change
Mar
2.70
2.70
2:30 PM Euro Zone
Euro-Zone CPI (YoY)
%
Mar F
1.40
Apr 20, 2018
7:30 PM Euro Zone
Euro-Zone Consumer Confidence
Value
Apr A
0.10
Apr 23, 2018
1:00 PM Germany
PMI Services
Value
Apr P
53.90
1:00 PM Germany
PMI Manufacturing
Value
Apr P
58.20
7:30 PM US
Consumer Confidence
S.A./ 1985=100
Apr
127.70
Apr 24, 2018
7:30 PM US
Existing home sales
Million
Mar
5.54
7:30 PM US
New home sales
Thousands
Mar
618.00
Apr 26, 2018
5:15 PM Euro Zone
ECB announces interest rates
%
Apr 26
-
Apr 27, 2018
6:00 PM US
GDP Qoq (Annualise d)
% Change
1Q A
2.90
1:25 PM Germany
Unempl oyment change (000's)
Thousands
Apr
(19.00)
2:00 PM UK
GDP (YoY)
% Change
1Q A
1.40
Apr 30, 2018
6:30 AM China
PMI Manufacturing
Value
Apr
51.50
May 01, 2018
2:00 PM UK
PMI Manufacturing
Value
Apr
55.10
Source: Bloomberg, Angel Research
Market Outlook
April 13, 2018
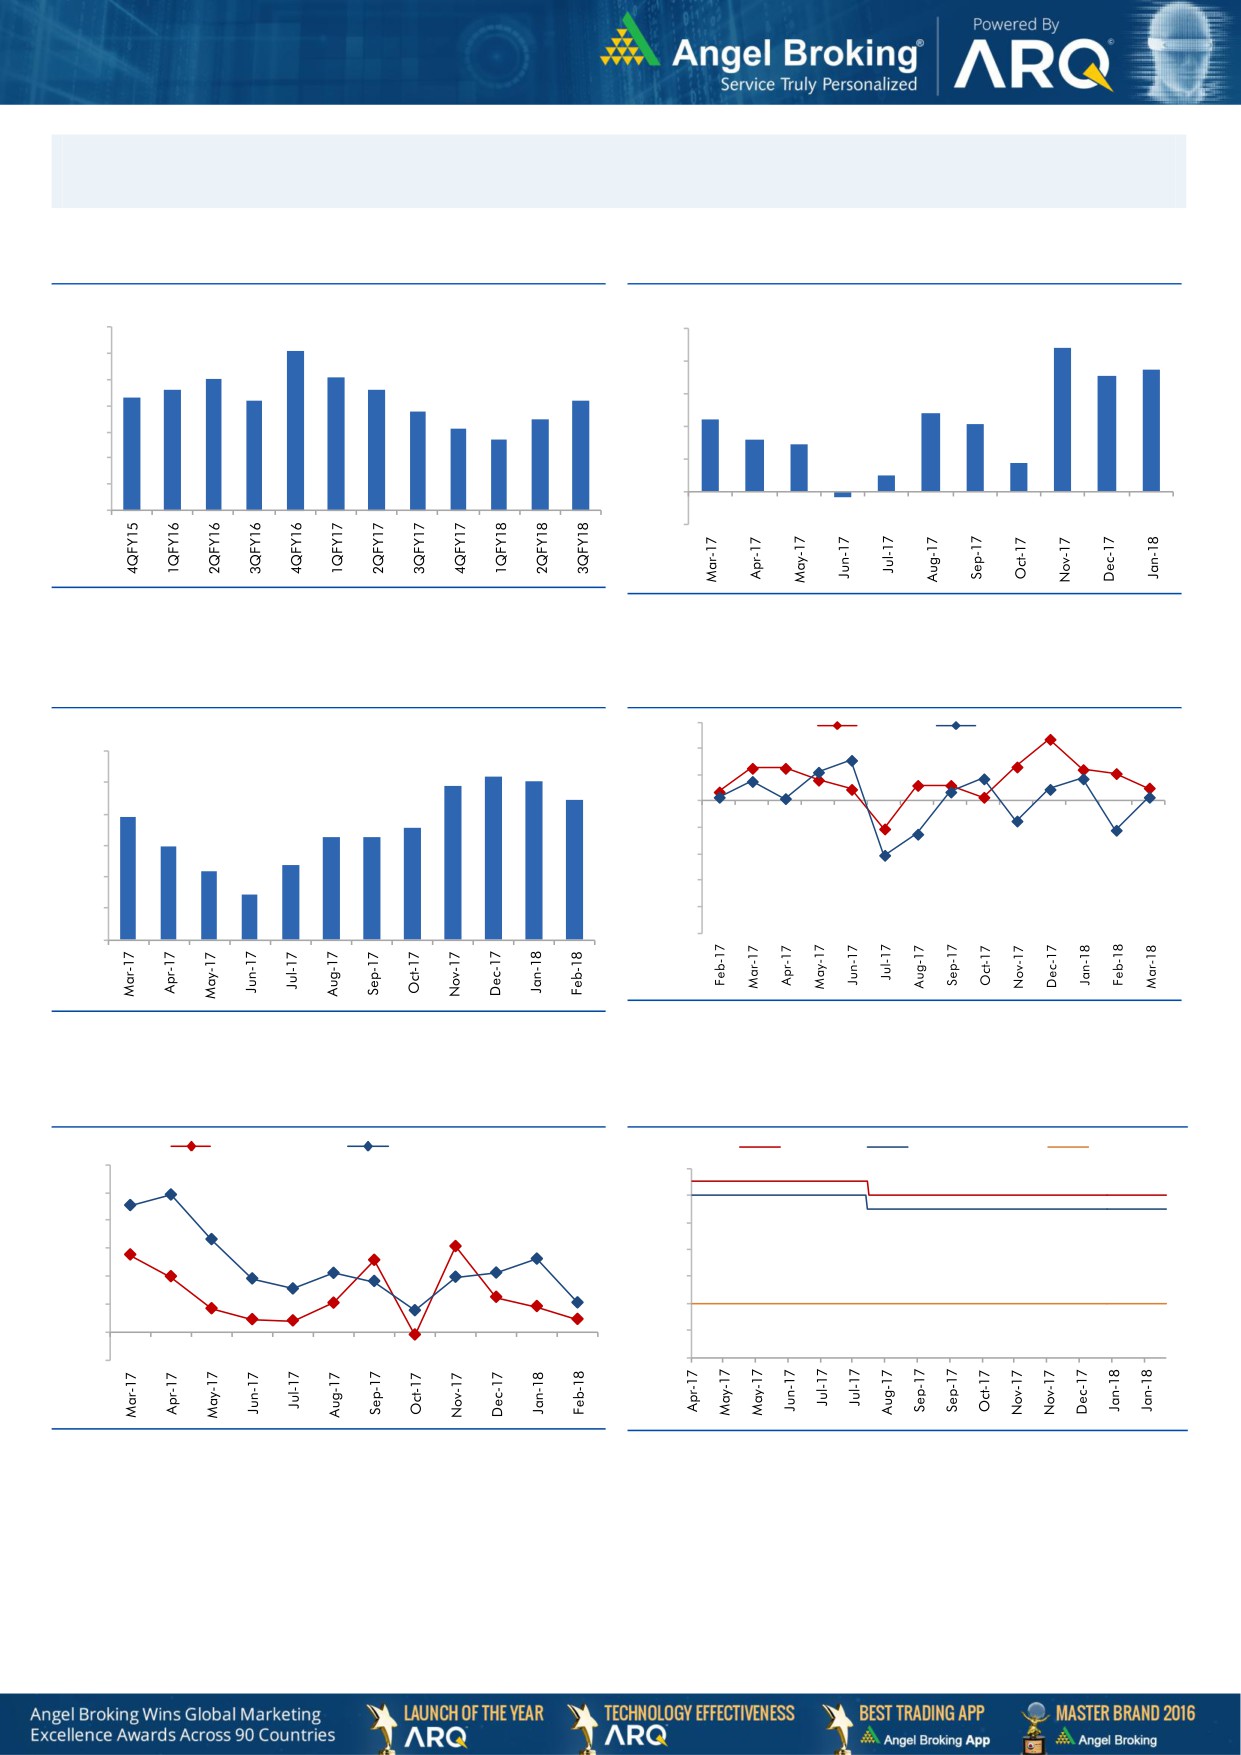
Macro watch
Exhibit 1: Quarterly GDP trends
Exhibit 2: IIP trends
(%)
(%)
10.0
10.0
9.1
8.8
9.0
7.5
8.0
8.1
8.0
7.1
7.6
7.6
8.0
7.3
7.2
7.2
6.8
6.0
4.8
7.0
6.5
4.4
6.1
4.1
5.7
4.0
3.2
2.9
6.0
1.8
5.0
2.0
1.0
4.0
-
3.0
(0.3)
(2.0)
Source: CSO, Angel Research
Source: MOSPI, Angel Research
Exhibit 3: Monthly CPI inflation trends
Exhibit 4: Manufacturing and services PMI
56.0
Mfg. PMI
Services PMI
(%)
6.0
54.0
5.2
5.1
4.9
52.0
5.0
4.4
3.9
50.0
4.0
3.6
3.3
3.3
3.0
48.0
3.0
2.4
2.2
46.0
2.0
1.5
44.0
1.0
42.0
40.0
-
Source: Market, Angel Research; Note: Level above 50 indicates expansion
Source: MOSPI, Angel Research
Exhibit 5: Exports and imports growth trends
Exhibit 6: Key policy rates
(%)
Exports yoy growth
Imports yoy growth
(%)
Repo rate
Reverse Repo rate
CRR
60.0
6.50
50.0
6.00
40.0
5.50
30.0
5.00
20.0
4.50
10.0
4.00
0.0
3.50
(10.0)
3.00
Source: Bloomberg, Angel Research
Source: RBI, Angel Research
Market Outlook
April 13, 2018
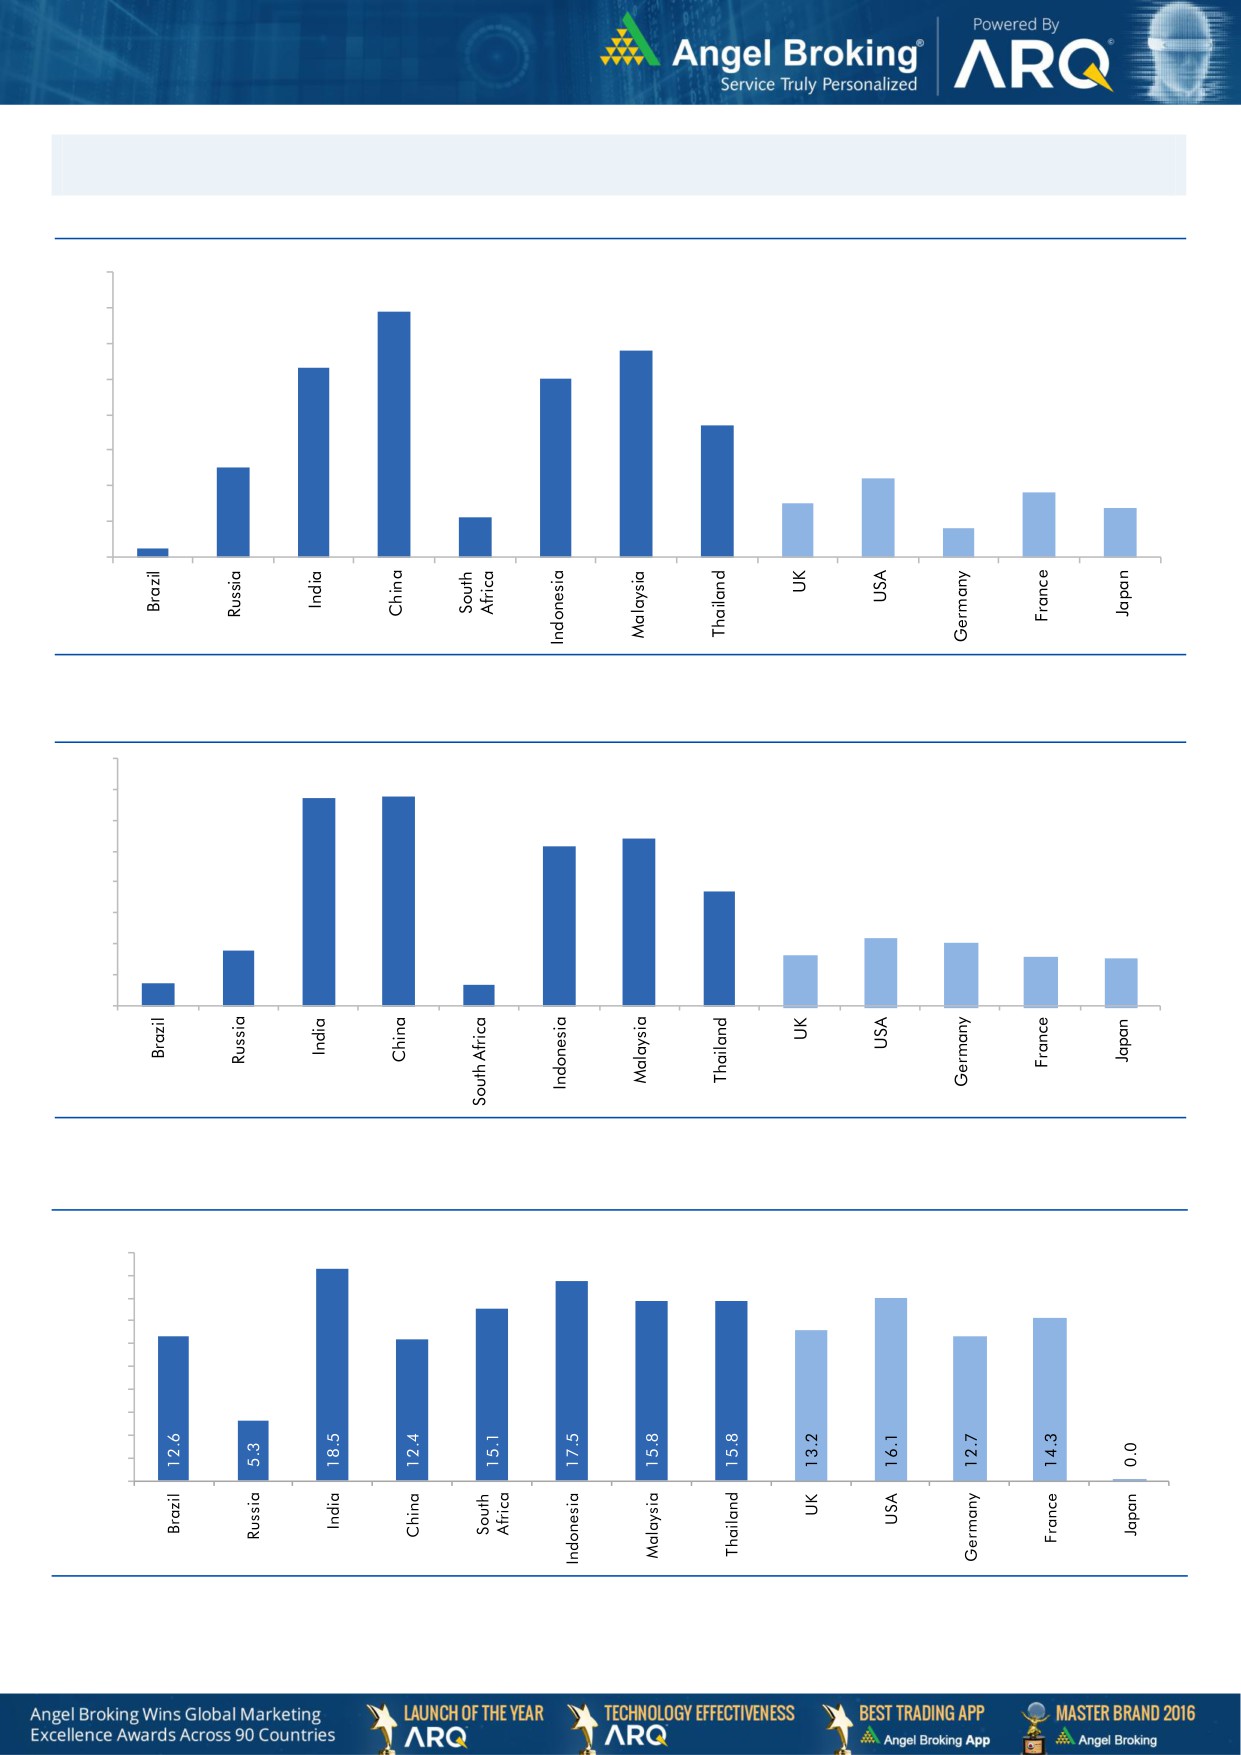
Global watch
Exhibit 1: Latest quarterly GDP Growth (%, yoy) across select developing and developed countries
(%)
8.0
6.9
7.0
5.8
6.0
5.3
5.0
5.0
1.1
3.7
4.0
2.5
3.0
2.2
1.8
2.0
1.5
1.4
0.8
1.0
0.3
-
Source: Bloomberg, Angel Research
Exhibit 2: 2017 GDP Growth projection by IMF (%, yoy) across select developing and developed countries
(%)
6.7
6.8
7.0
6.0
5.4
5.2
5.0
3.7
4.0
3.0
1.8
2.2
2.0
1.7
1.6
2.0
0.7
1.5
0.7
1.0
-
Source: IMF, Angel Research
Exhibit 3: One year forward P-E ratio across select developing and developed countries
(x)
20.0
18.0
16.0
14.0
12.0
10.0
8.0
6.0
4.0
2.0
-
Source: IMF, Angel Research
Market Outlook
April 13, 2018
Exhibit 4: Relative performance of indices across globe
Returns (%)
C ountry
Name of index
Closing price
1M
3M
1YR
Brazil
Bovespa
85,444
(1.7)
7.6
29.9
Russia
Micex
4,290
1.4
7.1
11.4
India
Nifty
10,459
2.3
(0.9)
13.7
China
Shanghai Composite
3,180
(4.5)
(6.1)
(2.8)
South Africa
Top 40
49,809
(4.3)
(6.3)
8.1
Mexico
Mexbol
48,783
1.1
(2.4)
(1.5)
Indonesia
LQ45
1,034
(2.4)
(4.9)
12.2
Malaysia
KLCI
1,874
0.5
2.6
7.2
Thailand
SET 50
1,166
(2.0)
0.1
16.7
USA
Dow Jones
24,483
(2.8)
(3.6)
18.9
UK
FTSE
7,258
0.5
(6.3)
(1.2)
Japan
Nikkei
21,660
(0.8)
(8.9)
14.8
Germany
DAX
12,415
0.6
(6.5)
2.3
France
CAC
5,309
0.7
(3.6)
6.4
Source: Bloomberg, Angel Research p68in4